UptimeKuma
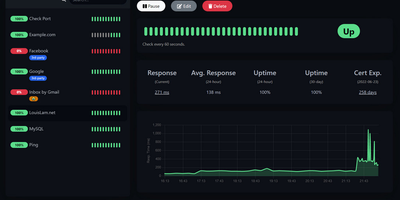
Sixty-thousand-plus GitHub stars make Uptime Kuma the most popular self-hosted monitoring tool - MIT-licensed, Node.js, and the standard replacement for UptimeRobot, Pingdom, and Freshping. It watches a dozen monitor types: HTTP(S) endpoints with keyword and JSON-query content validation, TCP ports, ICMP ping, DNS records, WebSockets, Docker containers via the socket, Steam game servers, MQTT brokers, gRPC services, and push-based heartbeats for cron jobs and internal workers. Checks run at intervals as tight as 20 seconds - versus UptimeRobot's 5-minute free tier - with unlimited monitors and unlimited data retention. When something fails, alerts fan out through 90+ notification channels: Slack, Discord, Telegram, email with LiquidJS templating, PagerDuty, OpsGenie, ntfy, Gotify, Matrix, and dozens more via native providers plus the Apprise library. Unlimited public or password-protected status pages - mappable to specific domains and organized into monitor groups - communicate health to customers, with maintenance windows that suppress alerts during planned work. The reactive dashboard graphs response times, tracks SSL certificate expiry with advance warnings, supports proxies and 2FA, and ships in dozens of languages. One Docker container with a SQLite volume covers an entire infrastructure.
Change Detection
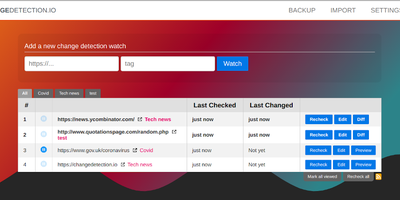
Price drops, restocks, job postings, government announcements, competitor edits - changedetection.io watches web pages and alerts you the moment anything changes, down to PDF text and checksums. Point it at a URL, set a check interval, and precise filters decide what counts as a change: a Visual Selector targets page elements by pointing and clicking, CSS selectors and XPath narrow scope, trigger-text and ignore-text rules (with regex support) cut noise, and JSONPath or jq handles API responses. A dedicated re-stock and price detection mode extracts product metadata and fires on thresholds - alert only when the price drops below your target or the percentage change exceeds a limit. JavaScript-heavy sites render through a real Chrome browser via Playwright, with the ability to execute JS steps first (log in, click, scroll) before extracting text. Notifications reach 85+ services through Apprise - Discord, Slack, Telegram, email, webhooks - optionally with a screenshot of the changed page, and AI-powered summaries (any OpenAI-compatible endpoint, including local Ollama) describe what changed. Per-watch proxies, custom headers, and POST/GET control cover hostile targets. Apache-2.0 licensed with local file-based storage: the URLs you monitor and why stay entirely your business.
Homarr
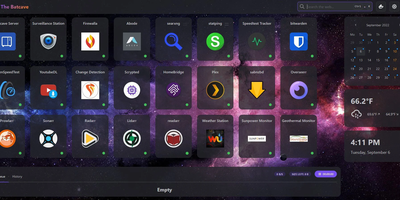
A single pane of glass for every service you run, arranged by drag-and-drop with no YAML or JSON files: Homarr is the modern dashboard for self-hosted infrastructure. Its grid system arranges apps, widgets, and bookmarks on desktop or touch, backed by an icon picker with over 11,000 icons. What separates Homarr from static launchers is 50+ live integrations: Plex, Jellyfin, and Emby media stats, the *arr suite (Sonarr, Radarr) with a unified release calendar, download clients, Pi-hole and AdGuard Home controls, Proxmox, Home Assistant, OPNsense, and Unifi monitoring. Widgets update in real time over WebSockets (tRPC and Redis under the hood), and a built-in search queries thousands of data points across connected services. Custom widgets extend the reach to any HTTP API without code: define endpoint, auth, and refresh interval in the management UI, then render responses as stat grids, tables, progress bars, status indicators, action buttons, or full custom JSX layouts - with an AI-prompt helper for generating templates. Multi-user support is first-class: credentials, OIDC, or LDAP sign-on, groups with granular permissions, and secrets encrypted with AES-256-CBC. A robust background-job system scales it from a Raspberry Pi homelab to deployments serving hundreds of users.

Tautuilli
Get ready to transform your Plex Media Server into a surveillance powerhouse with Tautulli! This nifty web app is like a personal assistant for your server, keeping tabs on all the who's, what's, when's, and how's of your media consumption. It's a statistics ninja, slicing and dicing data into digestible graphs and tables that even your grandma could understand. Want to know if your friends are binge-watching your movie collection while you're at work? Tautulli's got your back. It logs every giggle, gasp, and groan from your users, and even lets you send out snazzy newsletters to brag about your ever-growing media empire. And for those on the move, there's an official app to keep you in the loop. Best of all, hosting it on RepoCloud won't break the bank, leaving you with more cash to spend on popcorn. So, why wait? Give your Plex server a brain boost with Tautulli, and watch it on any python-friendly system!
Gotify
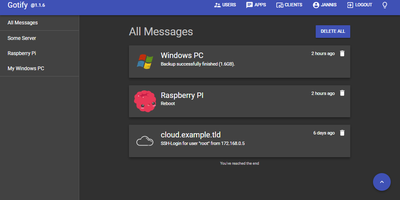
Real-time alerts from your own infrastructure to your phone, with no Firebase, Pushover, or third-party push service in the path: Gotify is a simple, self-hosted notification server written in Go. The model is deliberately minimal: senders push messages with a single HTTP POST to the REST API, receivers subscribe over a WebSocket stream, and a clean React web UI manages the pieces. Senders are namespaced as "applications," each with its own token, so your backup script, Uptime Kuma, CI pipeline, and cron jobs each get an identity, an icon, and independently revocable credentials - centralized alerting from many services with per-source management. Messages carry a title, body, and priority level that maps to notification importance on the client. The official Android app (on both F-Droid and Google Play, notable for working entirely without Google Play Services) shows push notifications for new messages; the web UI itself supports Web Push in the browser; and gotify/cli pushes messages from shell scripts with one command. A server-side plugin system adds custom behavior, and the whole thing runs as a single small binary with SQLite by default - near-zero resource footprint. Because dozens of tools (and Apprise) speak Gotify natively, it slots in as the notification hub for an entire homelab or ops stack.
Cachet
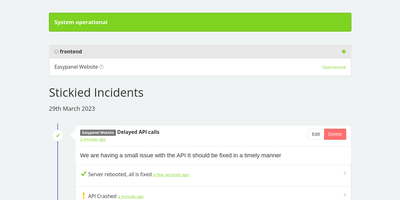
Introducing Cachet: the open-source superhero for managing those pesky downtime blues. Beloved by top-notch companies across the globe, Cachet is your go-to wingman for broadcasting those 'Oops, we'll be right back!' messages to customers, your squad, and the money folks. Sporting a snazzy outfit that looks fab on any device, Cachet is the epitome of style meets function. It's a polyglot, too, chatting in multiple languages and flexing a robust JSON API to keep your status updates as fresh as morning coffee. Want to pencil in some digital spa time for your servers? Cachet's got your back with pre-scheduled maintenance memos. And for the number crunchers, it's got a dashboard decked out with metrics to track your digital heartbeat. Plus, with two-factor authentication, it's like having a bouncer for your status page. Hosting it on RepoCloud? That's the cherry on top, giving you all the open-source goodness without burning a hole in your wallet. Cachet: because your status page should be as cool as your service.
Aptabase
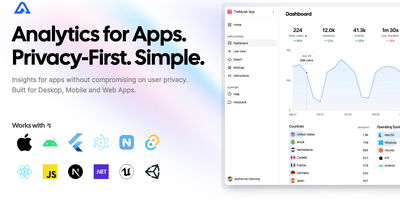
Web analytics tools ignore native mobile, desktop, and game apps; Aptabase was built for exactly those. If Firebase Analytics would force a privacy-policy footnote you don't want to write, this is the alternative - session-based metrics with no cookies, no IDFA or GAID, no device fingerprinting, and a daily-rotated salt that makes cross-day re-identification mathematically impossible. That design means GDPR, CCPA, and PECR compliance out of the box and "Data Not Collected" App Store privacy labels without ATT prompts. The SDK coverage is the widest in its category: eleven first-party libraries spanning Swift, Kotlin, Flutter, React Native, Tauri, Electron, .NET MAUI, NativeScript, Unity, Unreal Engine, and JavaScript for web - each MIT-licensed, following platform conventions, and accepting a custom host parameter that points at your instance. Integration is minutes: initialize with an app key, call trackEvent with optional properties, and the dashboard shows sessions, events, app versions, OS breakdowns, and country-level geography. The self-hosted stack is a .NET server over PostgreSQL for metadata and ClickHouse for high-volume event ingestion, giving cloud-parity features under an AGPL license. For indie iOS/Android apps, Electron and Tauri tools, and Unity or Unreal games, it replaces Firebase without the Google entanglement.
Tianji
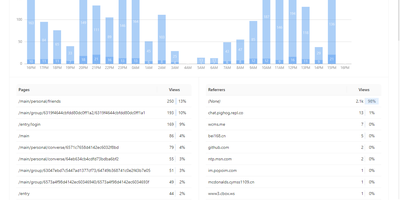
Website analytics, uptime monitoring, and server status - three tools most teams run separately - combined in Tianji, an open-source observability platform. The analytics layer tracks page views, unique visitors, referrers, and UTM parameters with a lightweight cookie-less script, which keeps collection GDPR and CCPA friendly. The uptime monitor checks availability and latency on configurable intervals, accepts passively reported results, and publishes public status pages for incident communication. Server status agents report CPU, memory, disk, and network metrics with threshold-based alerts, and notifications route through webhooks, Slack, Telegram, and other channels with noise control. It also includes anonymous telemetry for tracking deployments of your own open-source projects, surveys, waitlists, team collaboration, and an OpenAPI interface for integrations and exports. The consolidation is the point: traffic analytics, uptime checks, and server metrics share one interface and one alerting layer, so diagnosing an incident does not mean hopping between Google Analytics, Uptime Kuma, and Prometheus - and the built-in public status pages replace a separate paid Statuspage-style subscription. Because collection uses no cookies with IP truncation and aggregation by default, basic traffic measurement requires no consent banner. Built in TypeScript under the Apache 2.0 license and inspired by Umami and Uptime Kuma, it is deliberately right-sized for independent developers and small SaaS teams whose monitoring needs are real but lightweight.
Wg-easy
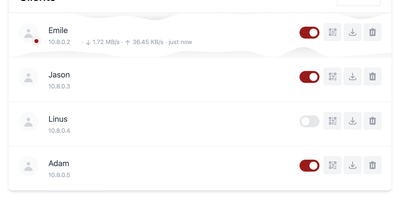
Get ready to wave goodbye to the command-line blues with WireGuard Easy! This snazzy app is your one-stop-shop for setting up and managing your very own WireGuard VPN like a pro, all from the comfort of a slick web interface. Fancy a bit of drag-and-drop? You got it! Want to peek at your client's QR code or snag their config file without breaking a sweat? Consider it done! And for the stats lovers, we've got charts that'll make your heart sing with real-time connection deets, complete with Tx/Rx serenades. Just make sure your Linux host is WireGuard-ready and Docker-friendly, and you're all set to join the easy-peasy VPN league. Host it on RepoCloud, and you'll be the MVP of VPNs without spending a fortune. It's like having a VPN wizard in your pocket – minus the pointy hat and the wand!
Prometheus
Meet Prometheus, the monitoring superhero you never knew you needed! Forget about those boring old dashboards that look like they were designed in the 90s—Prometheus brings your metrics to life with the flair of a disco ball at a developer party! This open-source marvel collects data from your targets faster than you can say "scalability" and alerts you when things go south, ensuring you're always one step ahead of disaster (or at least one alert ahead). With its time-series storage, you can track your application's performance like a hawk, while PromQL lets you query data in real-time, making you feel like a data wizard casting spells. Plus, it plays well with others—integrating seamlessly with Docker, Kubernetes, and even your favorite alerting tools like Alertmanager, which means you'll get notifications via email, Slack, or carrier pigeon (okay, maybe not the last one). So, if you're tired of your monitoring tools being about as useful as a chocolate teapot, give Prometheus a whirl and watch your infrastructure shine brighter than your last side project!
Windmill
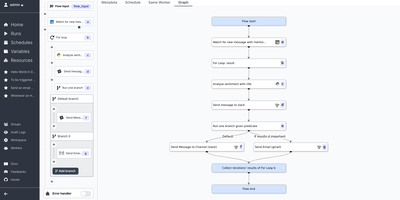
Get ready to harness the power of the almighty Windmill Cloud, the digital sorcerer that turns your humble scripts into mighty workflows and snazzy user interfaces quicker than you can say 'abracadabra'! Imagine crafting internal apps and Herculean workflows with just a sprinkle of code here and there. Windmill Cloud is your trusty sidekick, transforming your scripts into production-grade marvels. Unleash your inner developer wizard with a spellbook of languages like Python, Typescript, Go, Bash, and Sql. Conjure up scripts into workflows with a flick of low-code magic, and share your creations with an auto-magical UI or craft one with minimal toil and trouble. Whether you're running your digital empire on your own mystical lands or ours, Windmill Cloud stands vigilant with permissioning shields and monitoring spells included. It's the open-source Merlin to the proprietary kingdoms of Airplane, Superblocks & Retool, and it's a breeze to deploy across realms, be they quaint hamlets or sprawling metropolises. Command long-running background giants, weave scripts with intricate dependencies, conjure high-speed endpoints, or summon simple one-off tasks—all without breaking a sweat. Trigger these incantations from a webhook or the enchanted UI and keep a watchful eye with ease. Craft intricate flows from the simplest of scripts, plucked from your own enchanted workspace or the grand Hub. Assemble supercharged apps with a wave of your wand using drag-and-drop components, bind them to your data, and launch your app into the stratosphere in mere minutes. With Windmill Cloud's performance potions, your app will soar, unfazed by the weight of even the most complex spells. All this, hosted on RepoCloud, where the cost of casting these digital spells is but a fraction of the cloud giants' hoards. So, what are you waiting for? Let Windmill Cloud be the wind beneath your tech wings!
GlitchTip
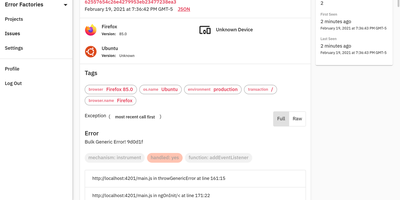
GlitchTip speaks Sentry's protocol without Sentry's operational weight - open-source error tracking that your existing SDKs already understand. The pitch is pragmatic: instrument your application with the official Sentry SDKs you already know - any language they cover - and point the DSN at your own GlitchTip instance instead. Errors, exceptions, log messages, and Content Security Policy violations flow into one place for triage, grouped into issues with stack traces, with alerts delivered by email or webhook the moment things break. Where self-hosted Sentry has ballooned into a docker-compose stack of twenty-plus containers, GlitchTip is a deliberately lean Django and PostgreSQL application a small team can actually run. Beyond errors, it bundles three more monitoring concerns: performance monitoring takes a works-out-of-the-box approach - no dashboard building, just your slowest web requests, database queries, and transactions surfaced automatically; uptime monitoring pings your sites and alerts on failures, or runs in reverse as a dead-man's-switch heartbeat for cron jobs that must check in on schedule; and log search puts application logs alongside errors for faster debugging. Unlimited projects and team members, MIT-licensed, built by Burke Software - your event volume is limited only by your own hardware.
SerpBear
Unlimited domains, unlimited keywords, daily Google position checks with stored history and trend charts: SerpBear is an open-source search engine rank tracker. Retrieval works through your choice of third-party SERP APIs - ScrapingAnt, ScrapingRobot, SerpApi, SearchApi, HasData - or your own proxy IP pool, and a flexible scrape-strategy system (Basic, Custom, or Smart, set globally or per domain) works around Google's removal of the 100-results-per-page parameter by choosing how many pages to check per keyword. Google Search Console integration adds real visit counts, impressions, and click-through rates per tracked keyword and surfaces top-performing pages and countries; Google Ads integration supplies monthly search volumes and auto-generates keyword ideas from your site's content. Email notifications report position changes daily, weekly, or monthly, a built-in REST API feeds dashboards and reporting tools, and data exports to CSV. Built with Next.js on SQLite, deployed via Docker, installable as a PWA on mobile - with no per-keyword or monthly SaaS fees.
Statping-ng
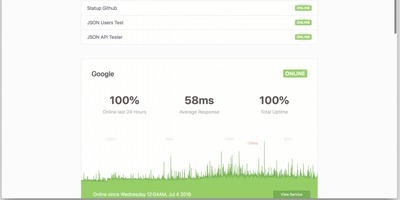
A status page and uptime monitor in one Go binary: Statping-ng - the actively maintained fork of Statping - replaces the UptimeRobot-plus-Statuspage combo with a ~20 MB Docker image using under 50 MB of RAM. It checks services over HTTP, TCP, UDP, ICMP ping, and gRPC health checks on configurable intervals, with per-service timeouts, expected status codes, POST requests with custom JSON bodies, SSL verification, and failure thresholds before alerting. The public status page is the differentiator against plain monitors: visitors see live status, uptime percentages, and latency charts grouped into service categories, with incident announcements and scheduled-maintenance messages you publish from the dashboard - and Sass-based custom styling matches the page to your brand rather than a vendor template. When something fails, notifiers fire immediately: Slack, Discord, Telegram, SMTP email, PagerDuty, Twilio SMS, Pushover, and custom webhooks, each testable before saving. Because notifiers are single Go files, the plugin system makes new channels straightforward. A RESTful API manages services and reads uptime data programmatically, and the free Statping mobile app connects to your server via QR code for on-the-go monitoring. Data persists to SQLite, MySQL, or PostgreSQL. Point it at internal services too - anything the container can reach is monitorable.

Ntfy
Get ready to elevate your notification game with ntfy – it's like having a personal town crier for the digital age! This nifty little app turns your phone or desktop into a buzzing hub of updates, all thanks to the magic of HTTP-based chit-chat. Whether you're knee-deep in code or just waiting for that marathon script to finally say 'I'm done!', ntfy is your go-to for keeping in the loop. Just pop the app onto your trusty smartphone, pick a topic that tickles your fancy, and voilà – you're the master of messages! And the best part? It's as free as your grandma's love, but you can throw some coin their way with a premium plan if you're feeling generous. Host it on RepoCloud, and you'll be saving more dough than a budget bakery – all while supporting the open-source vibe!
Dozzle
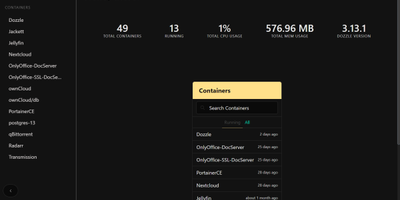
Introducing Dozzle: the featherweight champion of the Docker log viewing world, now streaming live on RepoCloud! Imagine a world where logs roll out the red carpet in real-time, and Dozzle is your all-access pass. It's like having a backstage pass to your Docker containers' most intimate thoughts, without the hassle of hitting refresh. This little gem is as resource-conscious as a monk, sipping on CPU and memory so lightly, you'll forget it's even there. Want to play the field with multiple remote hosts? Dozzle's got you covered with a nifty drop-down menu that's smoother than a buttered slide. And for the log-loving detectives, Dozzle's fuzzy search and regex prowess turn log sleuthing into child's play. Split screens? Check. Live performance stats? Double-check. And because we're all about that 'cloak and dagger' life, Dozzle comes with username and password protection to keep your log peeping secure. All this, hosted on RepoCloud, where the cost is as tiny as Dozzle's digital footprint. Get ready to monitor like a boss!
Grafana
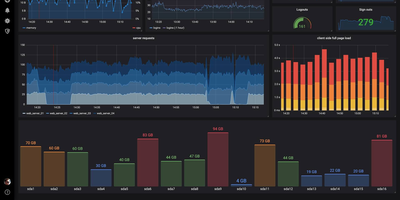
The de facto dashboard of observability: Grafana is the open-source frontend that turns the data stores you already run into interactive graphs. It does not store metrics itself; it connects to the data stores you already run and turns their contents into interactive dashboards. Supported sources number over 150 via plugins: Prometheus, Loki, Tempo, InfluxDB, Elasticsearch, MySQL, PostgreSQL, Microsoft SQL Server, AWS CloudWatch, Azure Monitor, Google Cloud Monitoring, and many more. Dashboards are built from a large library of panel types (time series, heatmaps, tables, gauges, logs) with template variables for reusable, parameterized views. Unified alerting evaluates rules against any connected data source, not just Prometheus, and routes notifications to Slack, PagerDuty, email, and other channels with grouping and silencing - unlike Prometheus Alertmanager, a single rule can combine a Loki log pattern, a PostgreSQL query result, and a CloudWatch metric. Dashboards serialize to JSON and data sources configure via provisioning files, so the entire observability setup can live in Git and deploy repeatably across environments. Explore mode adds ad-hoc querying outside dashboards, with split view for correlating a metric spike against the matching log lines, and access control spans organizations, teams, folder permissions, and OAuth, LDAP, and SAML integration. Written in Go and TypeScript, AGPL-licensed. Self-hosting gives you unlimited users, dashboards, and queries at flat hosting cost, without Grafana Cloud's usage-based pricing.
OctoPrint
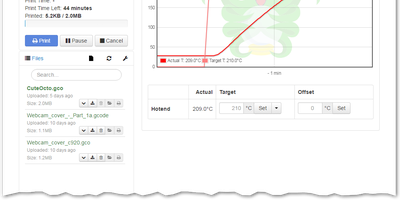
Over a million active instances make OctoPrint the standard web interface for consumer 3D printers - Gina Häußge's Python application, the center of the printing world since 2012. It talks to your printer over USB serial and turns every browser into a control panel: upload, organize, and start G-code prints; watch hotend and bed temperature graphs in real time; drive the print head manually; adjust feed rate, flow, and fan speed mid-print; and hit an emergency stop if things go wrong. The G-code visualizer renders the current layer in sync with the job, and a connected webcam adds a live feed plus automatic timelapse recording of every build. What keeps OctoPrint ahead is its plugin ecosystem - 300+ community plugins installable from the built-in manager. Highlights include Obico's AI spaghetti detection that pauses failed prints automatically, OctoEverywhere for tunnel-based remote access, Bed Level Visualizer's 3D mesh of your bed surface, PrintTimeGenius for accurate time estimates, Exclude Region to abandon one failed object mid-print while others continue, and Firmware Updater to flash Marlin or Klipper without SD-card shuffling. Event hooks fire notifications when prints finish or fail, and a full REST API supports slicer integration and custom automation. AGPL-licensed.