Ubuntu VPS
A minimal Ubuntu 24.04 LTS virtual private server — no pre-installed applications, no opinionated configuration, just the operating system and root access. Start from a clean slate and install exactly what you need: web servers, databases, development toolchains, CI runners, monitoring stacks, VPN endpoints, game servers, or anything else that runs on Linux. The server ships with apt package management, systemd service supervision, and standard networking configured out of the box, giving you access to over 36,000 packages in the Universe repository alone. Connect via SSH with the key you select during deployment; a dedicated IPv4 address is included with every server at no extra charge. A browser-based serial console in the RepoCloud dashboard provides emergency access without an SSH client. Snapshots let you capture the server state before risky changes and roll back with one click. Resize CPU and RAM on demand without reinstalling. Canonical's standard security maintenance covers this LTS release through May 2029 — five years of patches for the Main repository. Ubuntu Pro extends that to ten years with additional Universe coverage, kernel livepatching, and compliance tooling, available free for up to five machines.
Dokploy VPS
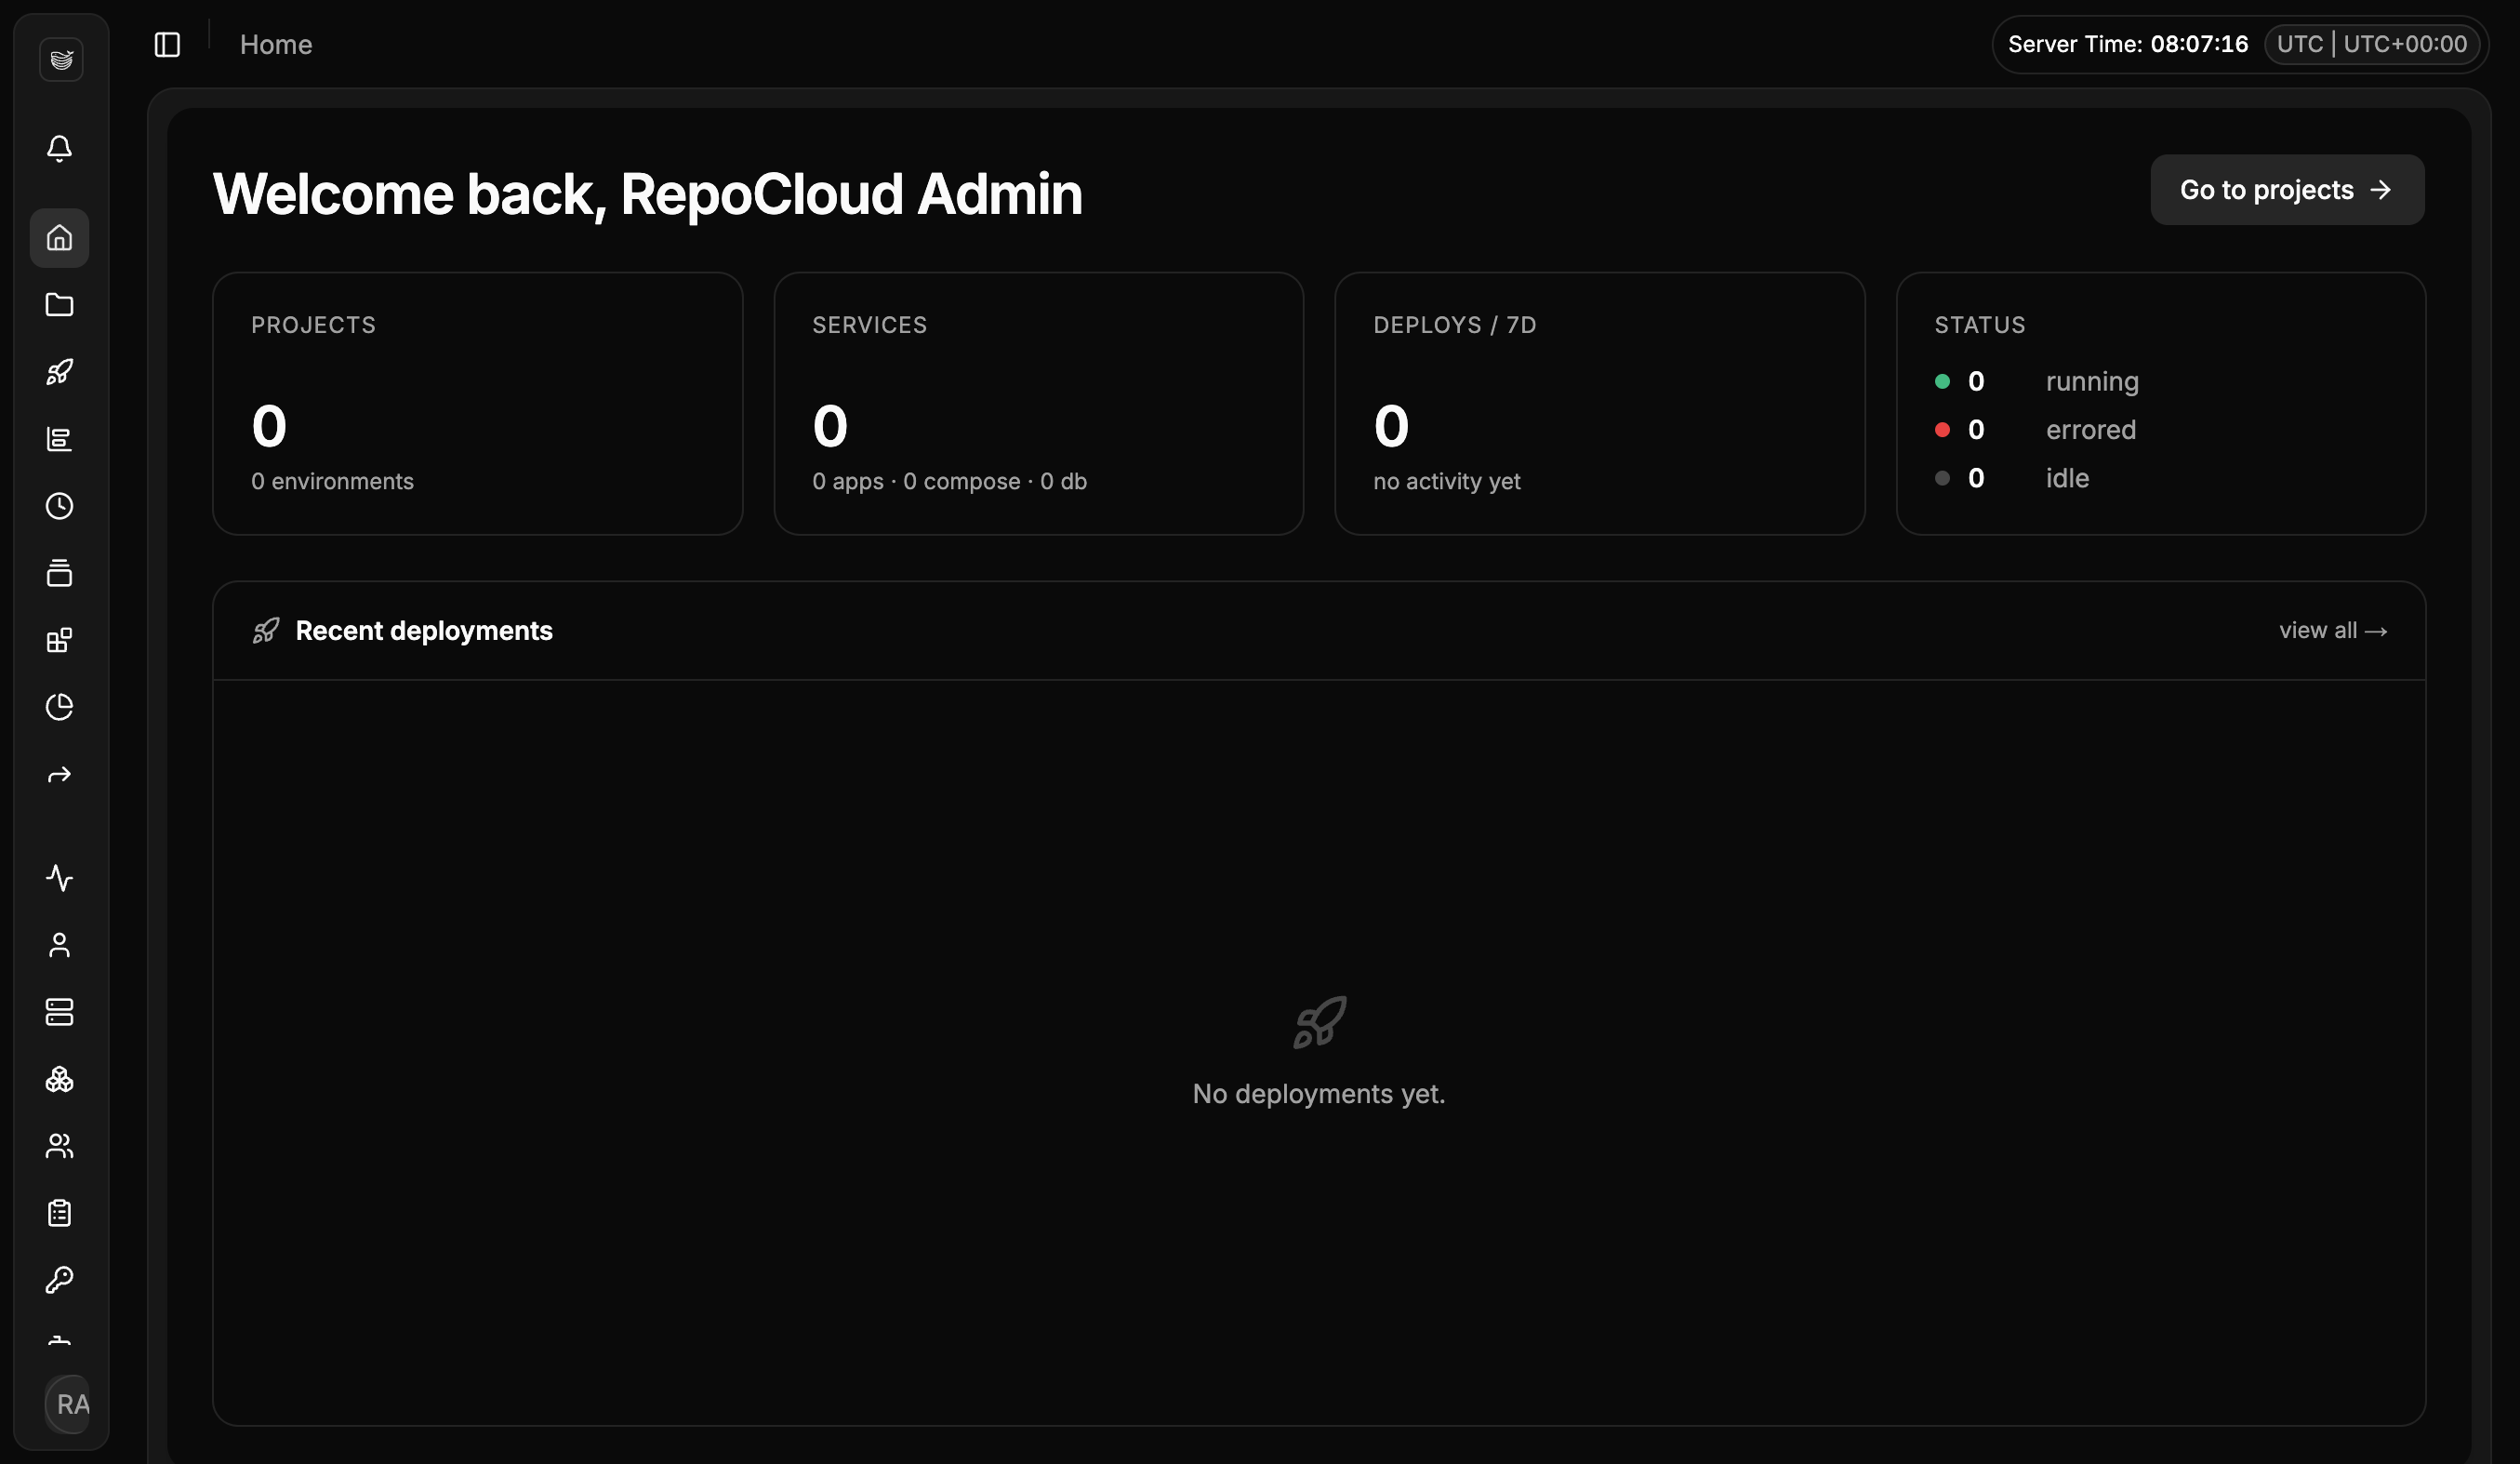
Your own Heroku or Vercel on a dedicated server — Dokploy is the open-source PaaS that replaces cloud platform subscriptions with a single dashboard you control. Point it at a Git repository or a Docker image, and it builds and deploys the application using Dockerfiles, Nixpacks, or Heroku/Paketo buildpacks. Traefik handles reverse proxying, routing, load balancing, automatic Let's Encrypt SSL, and HTTP/3. Databases — MySQL, PostgreSQL, MongoDB, MariaDB, libsql, and Redis — provision from the UI with automated backups to any S3-compatible destination. Complex multi-service applications deploy through native Docker Compose support, and multi-node scaling uses Docker Swarm. The web dashboard covers environment variables, volumes, resource limits, real-time CPU/memory/network monitoring, and deployment logs, with a CLI and REST API for automation. Deploy notifications go to Slack, Discord, Telegram, or email. One-click templates install common open-source tools, and a single control plane can manage deployments across multiple remote servers. Because everything is standard Docker, there is no lock-in: Dockerfiles, Compose files, and data volumes work anywhere else Docker runs. The push-to-deploy workflow of a $20/seat cloud PaaS, running on a dedicated VPS with guaranteed CPU, RAM, SSD, and full root access — no per-app, per-environment, or per-seat fees regardless of how many applications you deploy. 26,000+ GitHub stars.
Coolify VPS
The open-source PaaS with 55,000+ GitHub stars and the largest one-click service catalog in its class — Coolify gives you the Vercel push-to-deploy workflow on a dedicated server you control. Connect a GitHub, GitLab, Bitbucket, or Gitea repository and every push builds and deploys automatically via Nixpacks, a Dockerfile, or Docker Compose, with Traefik or Caddy reverse proxying, automatic Let's Encrypt certificates, and per-branch preview deployments with their own URLs. Databases — PostgreSQL, MySQL, MariaDB, MongoDB, Redis — provision in a few clicks, and a catalog of 280+ one-click service templates covers WordPress, n8n, Grafana, MinIO, Plausible, Ollama, and more. One dashboard manages the entire server, with Docker Swarm available for clustering multiple nodes. Backups go to any S3-compatible storage with one-click restore, and a full API supports CI/CD integration. All configuration lives on your own server, so resources keep running even if you stop using Coolify — no vendor lock-in by design. Running on a dedicated VPS with guaranteed CPU, RAM, and SSD, full root access via SSH and browser console. Apache 2.0 licensed.
UptimeKuma
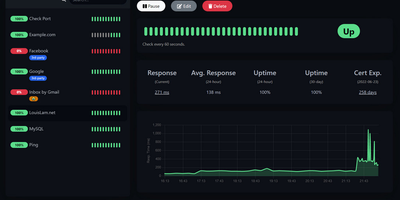
Sixty-thousand-plus GitHub stars make Uptime Kuma the most popular self-hosted monitoring tool - MIT-licensed, Node.js, and the standard replacement for UptimeRobot, Pingdom, and Freshping. It watches a dozen monitor types: HTTP(S) endpoints with keyword and JSON-query content validation, TCP ports, ICMP ping, DNS records, WebSockets, Docker containers via the socket, Steam game servers, MQTT brokers, gRPC services, and push-based heartbeats for cron jobs and internal workers. Checks run at intervals as tight as 20 seconds - versus UptimeRobot's 5-minute free tier - with unlimited monitors and unlimited data retention. When something fails, alerts fan out through 90+ notification channels: Slack, Discord, Telegram, email with LiquidJS templating, PagerDuty, OpsGenie, ntfy, Gotify, Matrix, and dozens more via native providers plus the Apprise library. Unlimited public or password-protected status pages - mappable to specific domains and organized into monitor groups - communicate health to customers, with maintenance windows that suppress alerts during planned work. The reactive dashboard graphs response times, tracks SSL certificate expiry with advance warnings, supports proxies and 2FA, and ships in dozens of languages. One Docker container with a SQLite volume covers an entire infrastructure.
Gotify
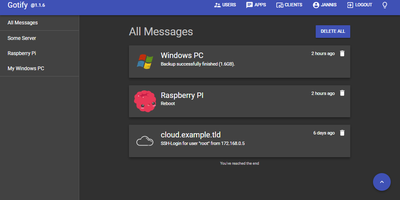
Real-time alerts from your own infrastructure to your phone, with no Firebase, Pushover, or third-party push service in the path: Gotify is a simple, self-hosted notification server written in Go. The model is deliberately minimal: senders push messages with a single HTTP POST to the REST API, receivers subscribe over a WebSocket stream, and a clean React web UI manages the pieces. Senders are namespaced as "applications," each with its own token, so your backup script, Uptime Kuma, CI pipeline, and cron jobs each get an identity, an icon, and independently revocable credentials - centralized alerting from many services with per-source management. Messages carry a title, body, and priority level that maps to notification importance on the client. The official Android app (on both F-Droid and Google Play, notable for working entirely without Google Play Services) shows push notifications for new messages; the web UI itself supports Web Push in the browser; and gotify/cli pushes messages from shell scripts with one command. A server-side plugin system adds custom behavior, and the whole thing runs as a single small binary with SQLite by default - near-zero resource footprint. Because dozens of tools (and Apprise) speak Gotify natively, it slots in as the notification hub for an entire homelab or ops stack.
pgweb
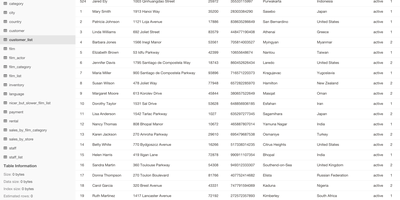
Inspect a PostgreSQL database right now, without installing pgAdmin or exposing Postgres to the internet - pgweb answers that recurring need. It's a Go application from Dan Sosedoff, a decade in development, shipped as a single statically-linked binary with zero dependencies - the Docker image is essentially just the executable - that puts a clean browser UI in front of any PostgreSQL 9.1+ server. Connect via URL string or host/port credentials, and browse tables, views, and sequences from the sidebar; selecting a table shows its rows immediately alongside tabs for structure, indexes, and constraints. The Query tab executes arbitrary SQL with query history, and the Explain Query button renders the query plan - estimated cost, row counts, execution strategy - which makes pgweb a quick performance-triage tool, not just a browser. Results and entire tables export to CSV, JSON, or XML in a click. Connectivity is more flexible than its size suggests: native SSH tunneling (password or key) reaches databases behind firewalls, server bookmarks make switching instances instant, and an optional multi-session mode handles several databases concurrently. For a RepoCloud stack full of Postgres-backed apps, one pgweb instance is the universal inspection hatch. MIT-licensed, actively maintained.
YAO
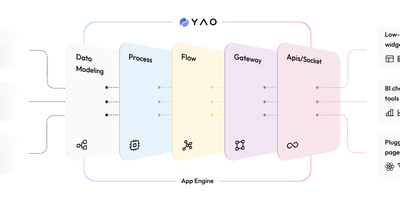
Get ready to unleash the beast of codeless creation with YAO – the Swiss Army knife of app engines that turns your grand ideas into web wonders faster than you can say 'deploy'! Whether you're crafting the next AI masterpiece, rigging up smart devices, or turbocharging connected cars, YAO's got your back. Picture this: a digital playground where databases dance to your tune without writing a single line of code, and interfaces are as easy to whip up as a peanut butter sandwich. IoT enthusiasts, edge computing aficionados, and industrial internet innovators – rejoice! YAO feels right at home on ARM devices, too. But wait, there's more! Business Intelligence just got a YAO-sized upgrade, offering you a treasure trove of functions to explore. Data flows like a river, and with YAO's built-in processes, you can navigate any data deluge. Fancy a bit of customization? The GRPC-based plug-in system is your gateway to endless possibilities with Nodejs, Python, and more. And let's talk security – YAO's like a digital Fort Knox, with permission layers so fine-grained, you'll need a microscope to see them. All this, hosted on RepoCloud, where the cost is as tiny as the footprint of a codeless app. So why settle for the cloud when you can reach for the stars with YAO on RepoCloud?
Jenkins
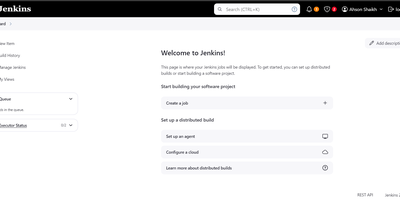
Welcome to Jenkins, the over-caffeinated automation server that’s like having a personal assistant who never sleeps and always remembers your build commands! Imagine a world where your software development process is smoother than a freshly brewed cup of coffee – that’s Jenkins for you! It’s the ultimate wingman for developers, tirelessly working behind the scenes to ensure your code is built, tested, and deployed faster than you can say 'continuous integration.' With Jenkins, you can finally stop worrying about those pesky manual tasks and focus on what really matters: arguing with your colleagues over the best pizza toppings during sprint meetings. Plus, it runs in servlet containers like Apache Tomcat, so you can feel fancy while you automate your way to success. So why not let Jenkins take the wheel while you kick back, relax, and enjoy the sweet, sweet taste of automated bliss? Your code will thank you, and so will your sanity!
GlitchTip
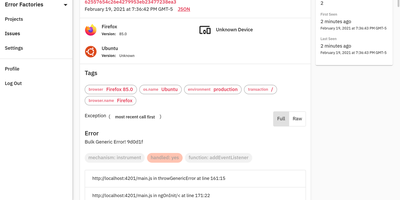
GlitchTip speaks Sentry's protocol without Sentry's operational weight - open-source error tracking that your existing SDKs already understand. The pitch is pragmatic: instrument your application with the official Sentry SDKs you already know - any language they cover - and point the DSN at your own GlitchTip instance instead. Errors, exceptions, log messages, and Content Security Policy violations flow into one place for triage, grouped into issues with stack traces, with alerts delivered by email or webhook the moment things break. Where self-hosted Sentry has ballooned into a docker-compose stack of twenty-plus containers, GlitchTip is a deliberately lean Django and PostgreSQL application a small team can actually run. Beyond errors, it bundles three more monitoring concerns: performance monitoring takes a works-out-of-the-box approach - no dashboard building, just your slowest web requests, database queries, and transactions surfaced automatically; uptime monitoring pings your sites and alerts on failures, or runs in reverse as a dead-man's-switch heartbeat for cron jobs that must check in on schedule; and log search puts application logs alongside errors for faster debugging. Unlimited projects and team members, MIT-licensed, built by Burke Software - your event volume is limited only by your own hardware.
Mattermost
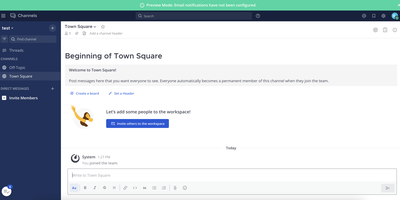
Teams that cannot send messages through someone else's cloud run Mattermost - the open-core, self-hosted alternative to Slack. It provides public and private channels, threaded discussions, unlimited search history, file sharing with previews, one-to-one audio calls, and screen sharing, with desktop clients for Windows, macOS, and Linux plus iOS and Android apps. Messages support full Markdown, which suits engineering conversations with code blocks and logs. Playbooks turn repeatable processes such as incident response and release management into checklist-driven workflows with automated triggers and retrospectives. Integration is a core strength: prebuilt connectors for GitHub, GitLab, Jira, ServiceNow, and PagerDuty, plus webhooks, slash commands, bots, a REST API, and a plugin marketplace with 700+ entries - together making it a working surface for ChatOps rather than just a chat room. Playbooks add keyword and event triggers, task assignment, status broadcasting, and post-incident retrospectives, so operational knowledge is not trapped in individuals' heads. The server is a single Go binary backed by PostgreSQL, with React clients, released monthly under MIT license and deployable fully air-gapped - which is why governments and defense organizations run it inside closed networks, and why the same control applies to any team with confidentiality requirements. The compiled Team Edition is free for unlimited users with no message history cutoff, so costs stay flat as the team grows.
PowerDNS-Admin
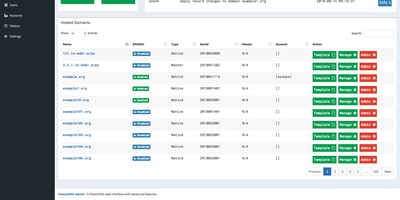
Raw zone files and API calls become something a whole team can operate safely once PowerDNS-Admin puts its web interface in front of a PowerDNS authoritative server. It's a Python/Flask application covering full forward and reverse zone management, with the touches that matter in daily DNS work: zone templates for stamping out consistent new domains, easy IPv6 PTR record editing (reverse zones by hand are misery), full IDN/Punycode support for internationalized domains, and DynDNS 2 protocol support so routers and scripts can update records the way they would against a commercial dynamic-DNS service. Access control is enterprise-grade: local users, LDAP against OpenLDAP or Active Directory, SAML, and OAuth via Google, GitHub, Azure, or OpenID Connect, hardened with TOTP two-factor authentication. Role-based permissions extend to zone-specific access control - hand a developer their project's zone without exposing the rest of your namespace - and activity logging records who changed which record when, the audit trail bare PowerDNS never gives you. The dashboard monitors PDNS service configuration and statistics, and its own API exposes zone and record management for automation on top of the UI. Runs against MySQL/MariaDB or PostgreSQL, talking to PowerDNS through its REST API. MIT-licensed.
Statping-ng
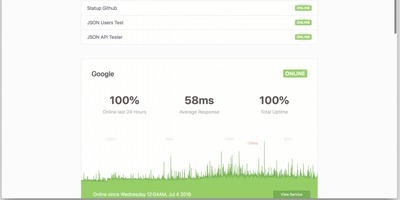
A status page and uptime monitor in one Go binary: Statping-ng - the actively maintained fork of Statping - replaces the UptimeRobot-plus-Statuspage combo with a ~20 MB Docker image using under 50 MB of RAM. It checks services over HTTP, TCP, UDP, ICMP ping, and gRPC health checks on configurable intervals, with per-service timeouts, expected status codes, POST requests with custom JSON bodies, SSL verification, and failure thresholds before alerting. The public status page is the differentiator against plain monitors: visitors see live status, uptime percentages, and latency charts grouped into service categories, with incident announcements and scheduled-maintenance messages you publish from the dashboard - and Sass-based custom styling matches the page to your brand rather than a vendor template. When something fails, notifiers fire immediately: Slack, Discord, Telegram, SMTP email, PagerDuty, Twilio SMS, Pushover, and custom webhooks, each testable before saving. Because notifiers are single Go files, the plugin system makes new channels straightforward. A RESTful API manages services and reads uptime data programmatically, and the free Statping mobile app connects to your server via QR code for on-the-go monitoring. Data persists to SQLite, MySQL, or PostgreSQL. Point it at internal services too - anything the container can reach is monitorable.
Vaultwarden
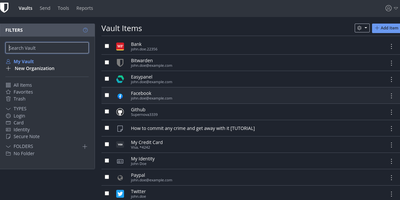
The Bitwarden server, reimplemented in Rust: Vaultwarden (formerly bitwarden_rs) is the unofficial lightweight edition. It speaks the same wire protocol as the official server, so every official Bitwarden client - browser extensions, iOS, Android, desktop, and the bw CLI - connects without modification, while the server itself runs as a single container against SQLite (or MySQL/MariaDB/PostgreSQL) instead of the official multi-container stack that wants gigabytes of RAM. Features Bitwarden gates behind paid tiers ship free: organizations with collections, groups, member roles, and policies; TOTP code storage; file attachments; Bitwarden Send; Emergency Access; event logs; and admin password reset. Two-factor options cover authenticator apps, email, FIDO2 WebAuthn, YubiKey, and Duo, and OIDC-based SSO landed natively in v1.35.0. Zero-knowledge encryption is unchanged - vault data is encrypted client-side and the master password never reaches the server. Attachments and Sends store on local disk or S3-compatible backends, an admin panel manages users and server settings, and backup is copying one data directory. Suited to individuals and teams up to roughly 50 users.
Verdaccio
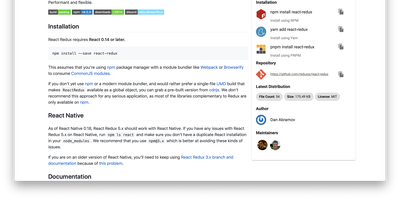
Private npm packages without shipping code to the public registry or paying for npm Enterprise: Verdaccio is the standard lightweight, zero-config private registry and caching proxy. It runs as a single Node.js process with its own tiny embedded database; no external database is required to start. Point npm, yarn, or pnpm at it and everything behaves as expected: install, publish, unpublish, dist-tags, and deprecation all work against the standard npm endpoints. The uplink system is where it earns its keep: packages not found locally are fetched from configured upstreams (npmjs.org, yarn, JFrog, Nexus, or another Verdaccio), cached as tarballs, and served locally thereafter - cutting CI latency and surviving registry outages. Multiple uplinks chain for failover, and per-package glob patterns in config.yaml route scopes to specific upstreams while controlling access, publish, and unpublish rights per group. You can even override a public package by publishing a patched version under the same name locally. A plugin architecture swaps in auth backends (htpasswd default, LDAP and others available), storage drivers (S3, Google Cloud Storage), middleware routes, and metadata filters. With official Docker images and a Kubernetes Helm chart, it slots into any pipeline in minutes.
phpMyAdmin
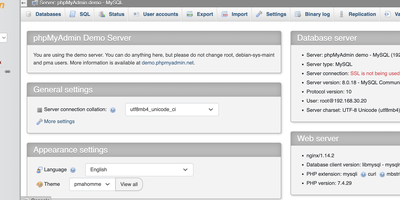
Since 1998, phpMyAdmin has been the standard web interface for MySQL and MariaDB - the tool millions of developers, DBAs, and hosting companies reach for when a database needs inspecting, fixing, or migrating. Written in PHP, it covers effectively the entire administration surface: create, browse, alter, and drop databases, tables, views, columns, and indexes; insert and edit rows through a tabular editor; manage user accounts and granular privileges; and maintain stored procedures, triggers, and events - all without touching a command line. The SQL editor executes arbitrary queries with syntax highlighting, autocompletion, history, and bookmarkable statements, including batch queries. Import/export is a migration workhorse: read SQL, CSV, XML, and OpenDocument spreadsheets in; write out to SQL dumps, CSV, JSON, XML, PDF, Word, LaTeX, and more - the fastest path for moving a WordPress database or handing a schema to a colleague. The Designer view renders your schema as an interactive ER diagram with drag-and-drop relationship editing, and data transformations display BLOBs as images or download links inline. Server maintenance views surface configuration suggestions. Multi-server support, dark mode, and translations into 72 languages round out a tool that earns its ubiquity. GPL-licensed.
Docker Registry
Ahoy, container enthusiasts! Set sail with Docker Registry 2.0, the swashbuckling storage sidekick for your Docker images. This app isn't just an implementation of the Docker Registry HTTP API V2; it's a compatibility wizard, joining forces with Docker versions 1.6 and up. Looking to hoist your registry solution to new heights or just want a cozy spot for your private collection? Docker Registry 2.0 has got your back, offering a fortress of security and a playground of scalability. It's the unsung hero behind the curtain of the Docker Hub, GitHub Container Registry, GitLab Container Registry, and DigitalOcean Container Registry, not to mention its star role in the CNCF Harbor Project and VMware Harbor Registry. Get ready to manage your digital treasures like a pro, with a content distribution system that's more extensible than a pirate's telescope. And with RepoCloud hosting, you'll be saving more doubloons than you can count, all while keeping the open-source spirit alive and kicking!
Coolify
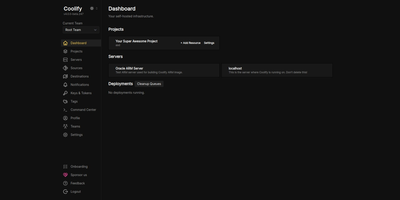
Any SSH-accessible Linux box - VPS, bare metal, Raspberry Pi, EC2 - becomes a Heroku-like deployment environment under Coolify, an open-source, self-hostable platform-as-a-service. Connect a GitHub, GitLab, Bitbucket, or Gitea repository and every push builds and deploys automatically via Nixpacks, a Dockerfile, or Docker Compose, with Traefik reverse proxying, automatic Let's Encrypt certificates, and per-branch preview deployments with their own URLs. Databases - PostgreSQL, MySQL, MariaDB, MongoDB, Redis - provision in a few clicks, and a catalog of 280+ one-click service templates covers WordPress, n8n, Grafana, MinIO, Plausible, and more, replacing an afternoon of Compose YAML with a two-minute operation. One dashboard manages multiple servers, with Docker Swarm available for clustering. Backups go to any S3-compatible storage with one-click restore, a browser terminal gives real-time server access, and a full API supports CI/CD integration. All configuration lives on your own servers, so resources keep running even without Coolify. Apache 2.0 licensed.
Grafana
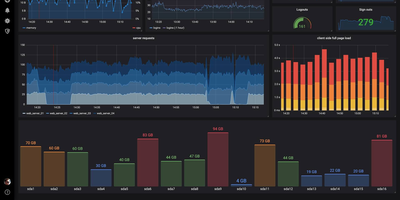
The de facto dashboard of observability: Grafana is the open-source frontend that turns the data stores you already run into interactive graphs. It does not store metrics itself; it connects to the data stores you already run and turns their contents into interactive dashboards. Supported sources number over 150 via plugins: Prometheus, Loki, Tempo, InfluxDB, Elasticsearch, MySQL, PostgreSQL, Microsoft SQL Server, AWS CloudWatch, Azure Monitor, Google Cloud Monitoring, and many more. Dashboards are built from a large library of panel types (time series, heatmaps, tables, gauges, logs) with template variables for reusable, parameterized views. Unified alerting evaluates rules against any connected data source, not just Prometheus, and routes notifications to Slack, PagerDuty, email, and other channels with grouping and silencing - unlike Prometheus Alertmanager, a single rule can combine a Loki log pattern, a PostgreSQL query result, and a CloudWatch metric. Dashboards serialize to JSON and data sources configure via provisioning files, so the entire observability setup can live in Git and deploy repeatably across environments. Explore mode adds ad-hoc querying outside dashboards, with split view for correlating a metric spike against the matching log lines, and access control spans organizations, teams, folder permissions, and OAuth, LDAP, and SAML integration. Written in Go and TypeScript, AGPL-licensed. Self-hosting gives you unlimited users, dashboards, and queries at flat hosting cost, without Grafana Cloud's usage-based pricing.