UptimeKuma
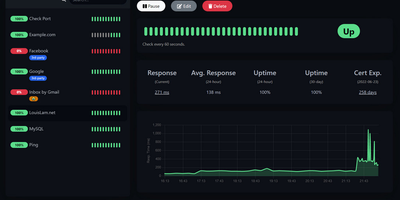
Sixty-thousand-plus GitHub stars make Uptime Kuma the most popular self-hosted monitoring tool - MIT-licensed, Node.js, and the standard replacement for UptimeRobot, Pingdom, and Freshping. It watches a dozen monitor types: HTTP(S) endpoints with keyword and JSON-query content validation, TCP ports, ICMP ping, DNS records, WebSockets, Docker containers via the socket, Steam game servers, MQTT brokers, gRPC services, and push-based heartbeats for cron jobs and internal workers. Checks run at intervals as tight as 20 seconds - versus UptimeRobot's 5-minute free tier - with unlimited monitors and unlimited data retention. When something fails, alerts fan out through 90+ notification channels: Slack, Discord, Telegram, email with LiquidJS templating, PagerDuty, OpsGenie, ntfy, Gotify, Matrix, and dozens more via native providers plus the Apprise library. Unlimited public or password-protected status pages - mappable to specific domains and organized into monitor groups - communicate health to customers, with maintenance windows that suppress alerts during planned work. The reactive dashboard graphs response times, tracks SSL certificate expiry with advance warnings, supports proxies and 2FA, and ships in dozens of languages. One Docker container with a SQLite volume covers an entire infrastructure.
Grafana
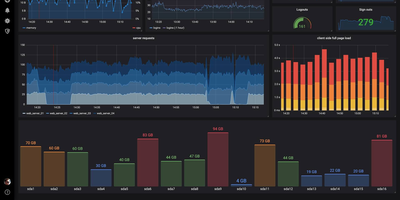
The de facto dashboard of observability: Grafana is the open-source frontend that turns the data stores you already run into interactive graphs. It does not store metrics itself; it connects to the data stores you already run and turns their contents into interactive dashboards. Supported sources number over 150 via plugins: Prometheus, Loki, Tempo, InfluxDB, Elasticsearch, MySQL, PostgreSQL, Microsoft SQL Server, AWS CloudWatch, Azure Monitor, Google Cloud Monitoring, and many more. Dashboards are built from a large library of panel types (time series, heatmaps, tables, gauges, logs) with template variables for reusable, parameterized views. Unified alerting evaluates rules against any connected data source, not just Prometheus, and routes notifications to Slack, PagerDuty, email, and other channels with grouping and silencing - unlike Prometheus Alertmanager, a single rule can combine a Loki log pattern, a PostgreSQL query result, and a CloudWatch metric. Dashboards serialize to JSON and data sources configure via provisioning files, so the entire observability setup can live in Git and deploy repeatably across environments. Explore mode adds ad-hoc querying outside dashboards, with split view for correlating a metric spike against the matching log lines, and access control spans organizations, teams, folder permissions, and OAuth, LDAP, and SAML integration. Written in Go and TypeScript, AGPL-licensed. Self-hosting gives you unlimited users, dashboards, and queries at flat hosting cost, without Grafana Cloud's usage-based pricing.
Prometheus
Meet Prometheus, the monitoring superhero you never knew you needed! Forget about those boring old dashboards that look like they were designed in the 90s—Prometheus brings your metrics to life with the flair of a disco ball at a developer party! This open-source marvel collects data from your targets faster than you can say "scalability" and alerts you when things go south, ensuring you're always one step ahead of disaster (or at least one alert ahead). With its time-series storage, you can track your application's performance like a hawk, while PromQL lets you query data in real-time, making you feel like a data wizard casting spells. Plus, it plays well with others—integrating seamlessly with Docker, Kubernetes, and even your favorite alerting tools like Alertmanager, which means you'll get notifications via email, Slack, or carrier pigeon (okay, maybe not the last one). So, if you're tired of your monitoring tools being about as useful as a chocolate teapot, give Prometheus a whirl and watch your infrastructure shine brighter than your last side project!